Top 10 Best System Monitoring Tools In The World 2026

Table of Contents
This ranking synthesizes data from multiple authoritative sources published in 2025 and 2026, including Gartner Peer Insights with more than 97 verified reviews, Cloud Native Computing Foundation project documentation, peer-reviewed academic validation from the ICSOC 2023 conference, and industry buyer's guides from New Relic, Dotcom-Monitor, and What's Up Gold. We weighed pricing transparency, deployment flexibility, integration depth, user satisfaction scores, and each platform's ability to handle modern cloud-native and hybrid infrastructure. Open-source tools were evaluated on community health, feature parity with commercial alternatives, and operational overhead.
The State of System Monitoring in 2026
The system monitoring tools market has shifted dramatically over the past three years. Infrastructure is no longer a collection of servers in a rack. It is a distributed mesh of containers, serverless functions, multi-cloud services, and legacy on-premises systems that all need visibility. The tools that thrive in 2026 are the ones that unify metrics, logs, traces, and network data into a single pane of glass while automating the detection of anomalies before they become outages.
Our analysis of the top 10 best system monitoring tools in the world for 2026 reflects this reality. The leaders combine breadth of coverage with AI-driven analytics. The challengers offer specialized depth or open-source flexibility. Every tool on this list earned its place through verified user feedback, market adoption, and demonstrated capability in production environments.
The Top 10 Best System Monitoring Tools In 2026:
1. Datadog
Datadog remains the most widely adopted observability platform in the world, and for good reason. It unifies infrastructure monitoring, application performance, log management, trace analysis, network flows, and cloud environment visibility into a single SaaS platform. The breadth is staggering: more than 4,500 integrations covering AWS, Azure, Google Cloud Platform, Kubernetes, and virtually every major technology stack in production today.
The platform's appeal lies in its AI-driven analytics. Datadog's anomaly detection learns baseline behavior for each metric and flags deviations in real time, which cuts down the noise that plagues less sophisticated tools. Dashboards are highly customizable, and the alerting engine supports complex conditions that reduce false positives.
Pricing starts at $15 per host per month, which is competitive for the feature set. But users consistently note that costs scale quickly as data volume grows. The learning curve is real, too. Teams new to Datadog often spend weeks before they feel fluent in its navigation and query language. Still, the platform's dominance is not accidental. It appears at the top of nearly every major 2026 monitoring tools comparison, including New Relic's own buyer's guide, which is a telling endorsement from a direct competitor.
2. Kentik
Kentik leads the network intelligence platform category in 2026 with the highest user satisfaction score on this list. Its 4.9 out of 5 rating across 97 verified Gartner Peer Insights reviews puts it ahead of every other infrastructure monitoring tool on that platform. That kind of consistency across nearly a hundred independent evaluations is rare.
Kentik's strength is network-first visibility. For organizations dealing with traffic routing, BGP issues, cloud path optimization, SaaS dependencies, or internet performance problems, Kentik offers the deepest toolset available. Its AI-guided investigation feature walks engineers through troubleshooting workflows, and its runbooks let teams encode their own architectural knowledge and response procedures directly into the platform.
Real-time mapping and a multi-tenant model make Kentik fast to deploy across many sites or customer environments. What distinguishes it most, though, is how tightly it correlates network signals with application and business impact. When a network issue affects revenue, Kentik shows that connection automatically. For network-heavy organizations, this is the tool to beat in 2026.
3. SolarWinds Network Performance Monitor
SolarWinds Network Performance Monitor, or NPM, remains the entrenched enterprise standard for traditional network monitoring. Its feature set is the deepest in the category, covering SNMP polling, NetFlow analysis, packet capture, and path analysis. The platform is used by roughly 60 percent of Fortune 500 companies, a market share that reflects decades of enterprise trust.
NPM excels in complex traditional IT environments. Windows Server shops, multi-platform deployments, and organizations with substantial on-premises infrastructure will find the toolset comprehensive and battle-tested. Alerting is robust, reporting is thorough, and the broader SolarWinds ecosystem integrates NPM with application, database, and server monitoring tools for full-stack visibility.
The trade-offs are well documented. NPM is resource-intensive, requiring dedicated polling engines for large environments, and licensing costs are substantial. The platform also carries the shadow of the 2020 SolarWinds supply chain attack, which has made some security teams cautious. Yet in traditional enterprise settings, NPM remains the safe, proven choice that IT leaders default to when they need reliability over innovation.
4. Dynatrace
Dynatrace approaches full-stack observability with a weapon no other vendor matches: Davis AI. This proprietary engine uses deterministic causal analysis rather than statistical correlation, which means it can trace a network anomaly through application code to business impact with a level of certainty that probabilistic systems cannot offer.
The platform excels at automatic service mapping and dependency graph generation, particularly in Kubernetes environments. It discovers services, maps their relationships, and establishes baselines without manual configuration. For organizations running legacy Java or .NET applications, Dynatrace's application performance monitoring is exceptionally deep, with byte-code-level instrumentation that provides granular insight into code execution.
Infrastructure monitoring starts at $69 per month, which is reasonable for the AI capabilities included. The real value, though, is in the time savings. Dynatrace identifies root causes automatically, eliminating the war-room sessions that consume engineering hours during major incidents. Teams that need network signals tightly correlated with application performance and user experience metrics will find Dynatrace the most intelligent option available.
5. Prometheus
Prometheus is the de facto standard for metrics collection in cloud-native environments, and its status as a graduated project of the Cloud Native Computing Foundation cements its position as the industry benchmark. It is free, open source under the Apache 2.0 license, and the default choice for Kubernetes monitoring across the globe.
Native service discovery through kube-state-metrics and cAdvisor means Prometheus automatically finds and monitors containerized workloads without configuration. The query language, PromQL, is powerful enough to express complex aggregation and alerting rules, and the ecosystem around it is vast. Most teams pair Prometheus with Grafana for visualization and alerting, and integrate it with Loki or OpenObserve for log and trace data.
The cost of Prometheus is operational, not financial. Running it at scale requires careful management of storage, retention policies, and alerting rules. The platform does not provide dashboards out of the box, so teams must build their own. Organizations willing to invest in that operational ownership gain complete control over their monitoring stack with zero licensing costs. For Kubernetes-first shops, Prometheus is not just a good choice. It is the default.
6. Zabbix
Zabbix is the leading enterprise-grade open-source monitoring platform, offering a level of flexibility that commercial tools struggle to match. The software is completely free, with no licensing costs regardless of how many hosts or metrics you monitor. That alone makes it attractive for organizations with large infrastructures and constrained budgets.
The platform has not stood still. Zabbix 7.0 LTS added native synthetic web monitoring with multi-step browser scenarios, allowing teams to test user journeys without separate tools. Zabbix 8.0 LTS, released in late 2025, introduced ClickHouse as an optional storage backend, which dramatically improves performance for very large environments with high metric throughput.
More than 1,000 integrations cover everything from SNMP devices to cloud APIs to custom applications. Alerting is flexible, routing notifications through email, SMS, PagerDuty, or Slack. The web UI is user-friendly, and mobile apps provide on-the-go visibility.
The barrier is setup complexity. Zabbix requires skilled in-house Linux and database expertise to deploy and tune properly. The templating system, while powerful, has a learning curve. Organizations with that expertise will find Zabbix the most cost-effective enterprise monitoring solution in 2026.
7. LogicMonitor
LogicMonitor approaches monitoring from an automation-first perspective. The platform is cloud-based, so there is no infrastructure to maintain, and its automated device discovery is the best in the category. Point LogicMonitor at a network segment, and it finds devices, identifies their types, and applies appropriate monitoring templates automatically.
This automation significantly reduces the manual setup burden in large environments. The platform tracks CPU load, memory usage, uptime, and other key performance metrics across on-premises and cloud resources from a unified dashboard. It supports both agent-based collection through the LM Collector and agentless monitoring via SNMP, WMI, JMX, and REST APIs.
LogicMonitor's LM Envision AIOps layer provides predictive alerting based on learned behavioral baselines. Rather than reacting to threshold breaches, the platform identifies anomalous patterns before they become critical. Compliance-oriented reporting makes it well suited for regulated industries including finance and healthcare.
Pricing is usage-based, which keeps entry costs low but requires careful capacity planning as environments grow. For organizations deploying across large, hybrid infrastructures that want rapid time-to-value, LogicMonitor is the strongest SaaS alternative on the market.
8. PRTG Network Monitor
PRTG Network Monitor from Paessler is an all-in-one solution that has earned a loyal following for its versatility. The sensor-based architecture is unique: each monitored parameter consumes a sensor, and PRTG offers more than 500 sensor types covering SNMP, WMI, NetFlow, sFlow, IPFIX traffic analysis, REST API endpoints, and custom scripts.
Everything lives in a single product, which simplifies procurement and training. The map designer allows custom infrastructure topology views with drag-and-drop simplicity, making it easy to create visual representations of complex networks for executive reporting. PRTG Hosted Monitor provides a cloud-managed deployment option for organizations that prefer not to run their own servers.
Pricing starts at roughly 150 euros per month for the PRTG 500 tier and scales to about 1,350 euros per month for the PRTG 10000 tier. The sensor-based licensing model means costs grow with monitoring depth, and most devices require 5 to 10 sensors for meaningful coverage. Large environments can find the sensor costs accumulating quickly.
PRTG remains one of the most versatile commercial monitoring tools available, particularly for organizations that want a single platform for servers, networks, and applications without juggling multiple vendors.
9. Netdata
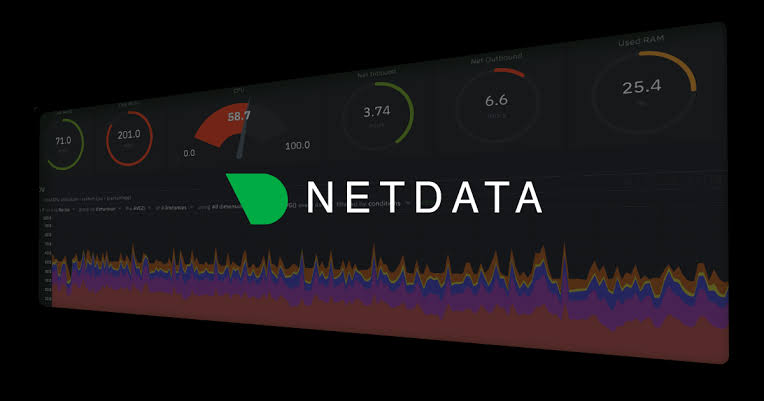
Netdata takes a different approach from every other tool on this list. It is a lightweight, real-time monitoring agent that provides immediate visibility into system health with zero configuration. Install it, and within seconds you see per-second granularity on CPU, memory, disk, network, and container metrics across every node in your infrastructure.
The performance credentials are impressive. Netdata was validated by the University of Amsterdam as the most energy-efficient monitoring solution in a peer-reviewed ICSOC 2023 study. This matters for organizations running large fleets where monitoring overhead translates directly into cloud bills and carbon footprints. The agent runs as a Kubernetes DaemonSet and collects per-pod metrics automatically, making it a natural fit for containerized environments.
Netdata is fully open source under the GPLv3+ license, with more than 615 contributors and 1.5 million downloads per day. Self-hosted deployment ensures data sovereignty, which is critical for organizations with strict data residency requirements. ADASTEC, a company building autonomous driving safety software, trusts Netdata for mission-critical monitoring in that unforgiving domain.
For teams that want real-time granularity without the operational weight of Prometheus, Netdata is the best choice in 2026.
10. Nagios

Nagios has been a monitoring standard for more than 25 years, and it remains relevant in 2026 through sheer staying power and a massive community. More than 10,000 community plugins extend the core platform to monitor virtually any device or application, and the free core version provides reliable infrastructure monitoring for servers, networks, and applications with flexible alerting.
The platform integrates with Grafana for modern visualization, and its documentation is thorough and battle-tested. For traditional IT environments, Nagios remains a proven choice that generations of engineers know how to operate. The commercial versions, starting at $1,995, add support and enterprise features.
The weaknesses are equally well known. The interface feels dated compared to modern tools. Cloud-native and containerized monitoring require significant manual configuration. Scaling to very large environments demands careful architecture and ongoing maintenance.
Yet for organizations with established Nagios deployments, or those wanting a free, highly customizable open-source option, the platform's longevity is itself a form of reliability. Twenty-five years of production use across tens of thousands of organizations is a track record that cannot be ignored.
The right system monitoring tool depends entirely on your environment and team capabilities. Datadog offers the broadest coverage for organizations willing to manage its cost. Kentik is the network specialist with the highest user satisfaction. SolarWinds NPM remains the enterprise standard for traditional infrastructure. Dynatrace provides the most advanced AI-driven root cause analysis.
Open-source options carry real weight in 2026. Prometheus is the Kubernetes standard, Zabbix offers enterprise scale without licensing costs, and Netdata delivers real-time granularity with minimal overhead. Nagios persists as the legacy workhorse.
Related Posts



1 Comment
Join the discussion and share your thoughts