Build Technical Infographics with Formulas, Arrows, and Annotations

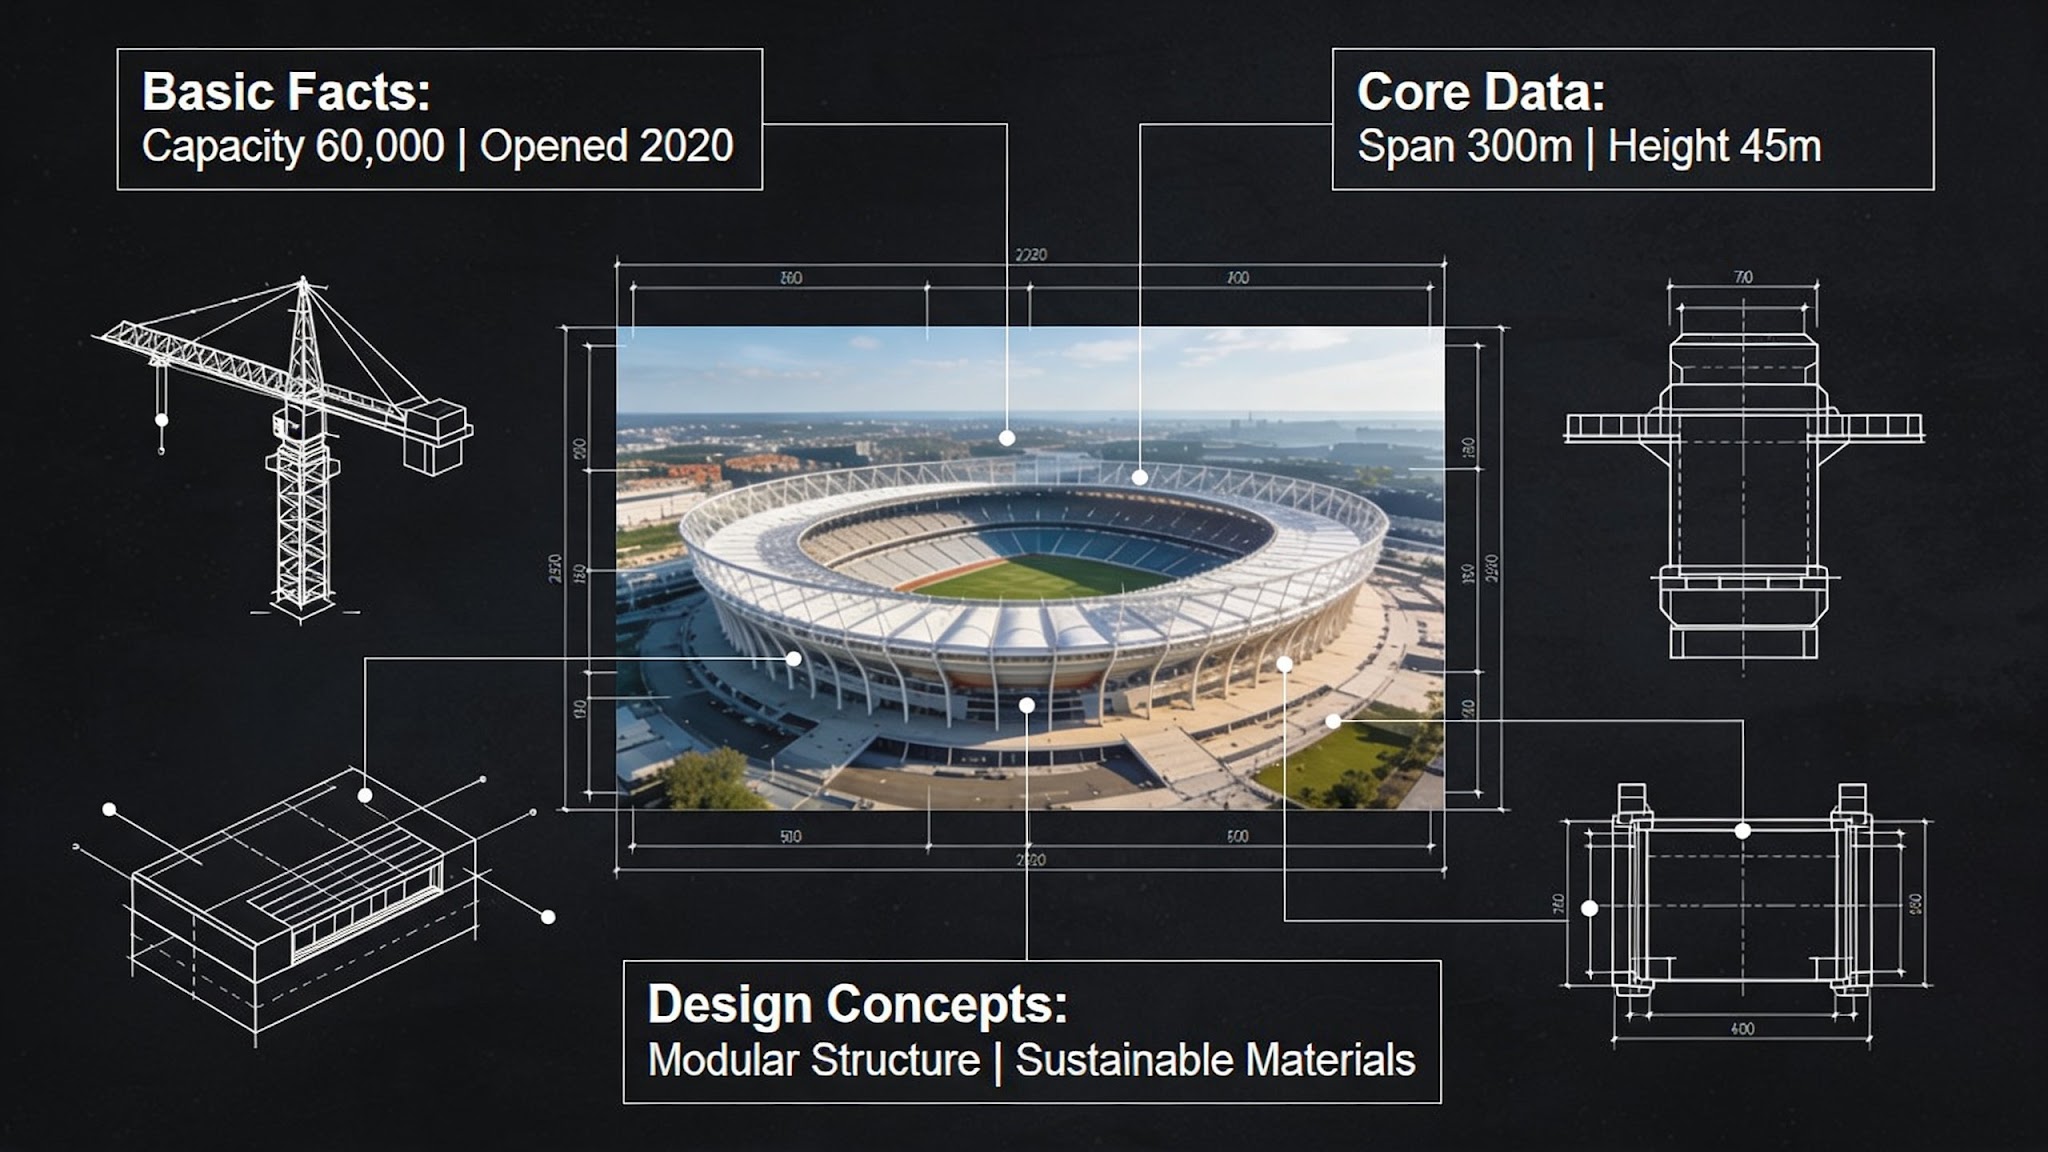
Table of Contents
Technical infographics are demanding. They need clear structure, readable labels, correct formulas, and arrows that point where they should. A small mistake can confuse the whole message. Dreamina's latest and most advanced image generation model, Seedream 5.5, is built to handle complex information design, including text in complex scenes, sensible structure, and layout and color optimization. That makes it a strong partner for science and engineering visuals.
In this guide, we'll use the manual's orbital mechanics example to show how a technical infographic comes together in Dreamina.
Why technical infographics are hard
A technical infographic combines drawing, writing, and math. The picture must show the idea, the labels must name the parts, and the formulas must be correct.
Layout matters too. If annotations crowd the diagram, readers lose the point. If arrows are unclear, they misread the direction. Dreamina with Seedream 5.5 helps you test several structures quickly, so you can find the clearest arrangement before polishing details.
Meet Seedream 5.5, Dreamina's most advanced image generation model
Seedream 5.5 powers Dreamina's newest image tools and treats information design as a core strength. Its main highlights include:
- RGBA transparent layered generation for reusable assets
- Precise editing of specified areas
- Complex information design with accurate text and reasonable structure
- Improved portrait realism
- Intelligent lighting with movie-style presets
For infographics, the manual points to canvas layout and color scheme optimization, along with accurate text in complex scenes.
The orbital mechanics example
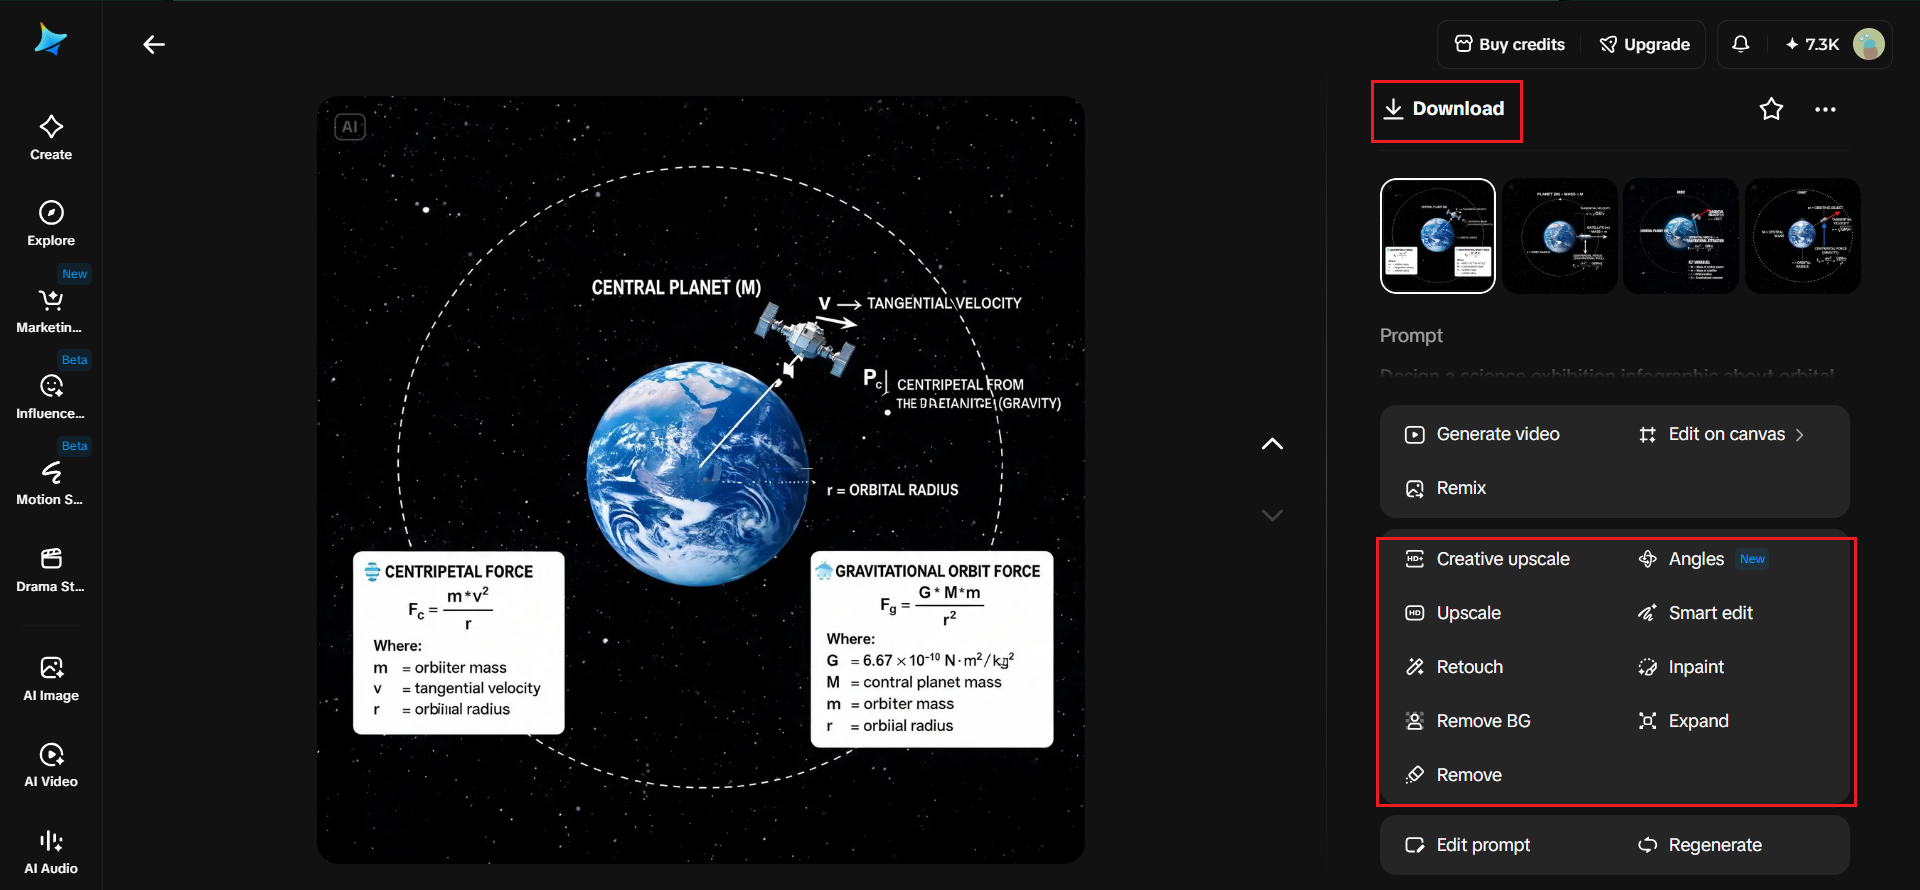
The manual's orbital mechanics concept is aimed at aerospace and science exhibitions. It features a circular orbit, tangential velocity, and the centripetal attractive force, with a 3D planet paired with formulas and annotations.
This example is useful because it mixes illustration and equations. A planet gives the visual anchor, an orbit line shows the motion, and arrows and labels explain what is happening. You can reuse the same pattern for other physics ideas.
Create a technical infographic in 3 fun steps with Dreamina
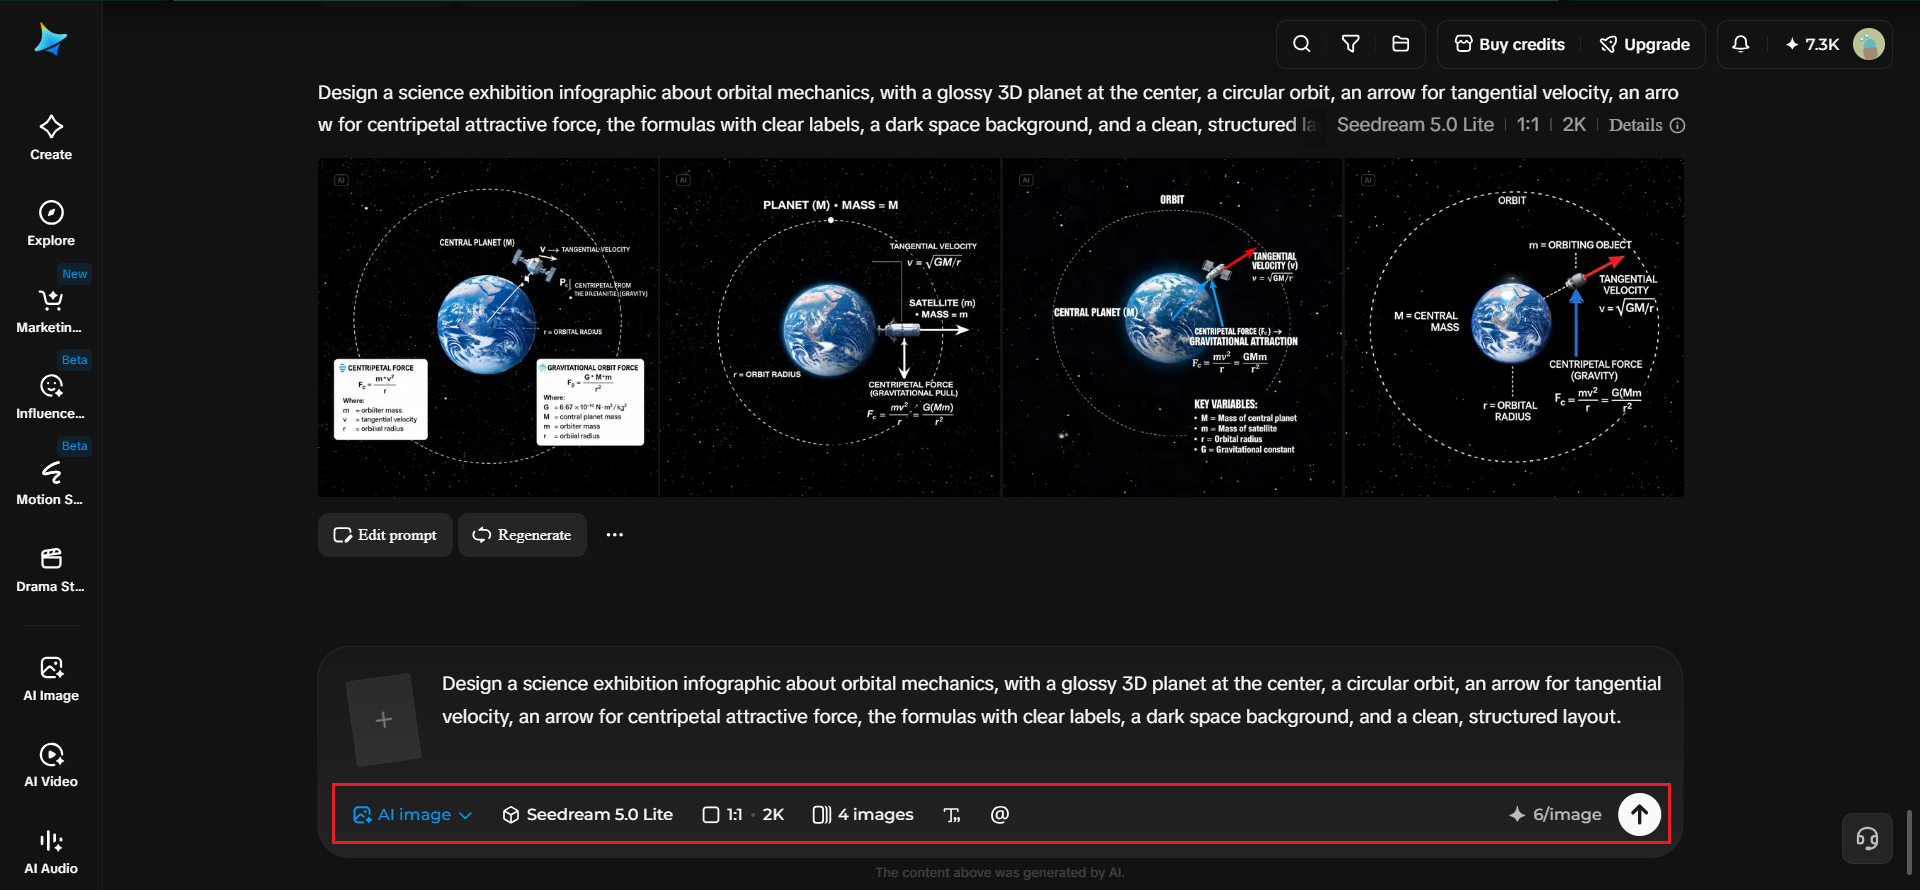
Step 1: Open Dreamina and write detailed text prompts
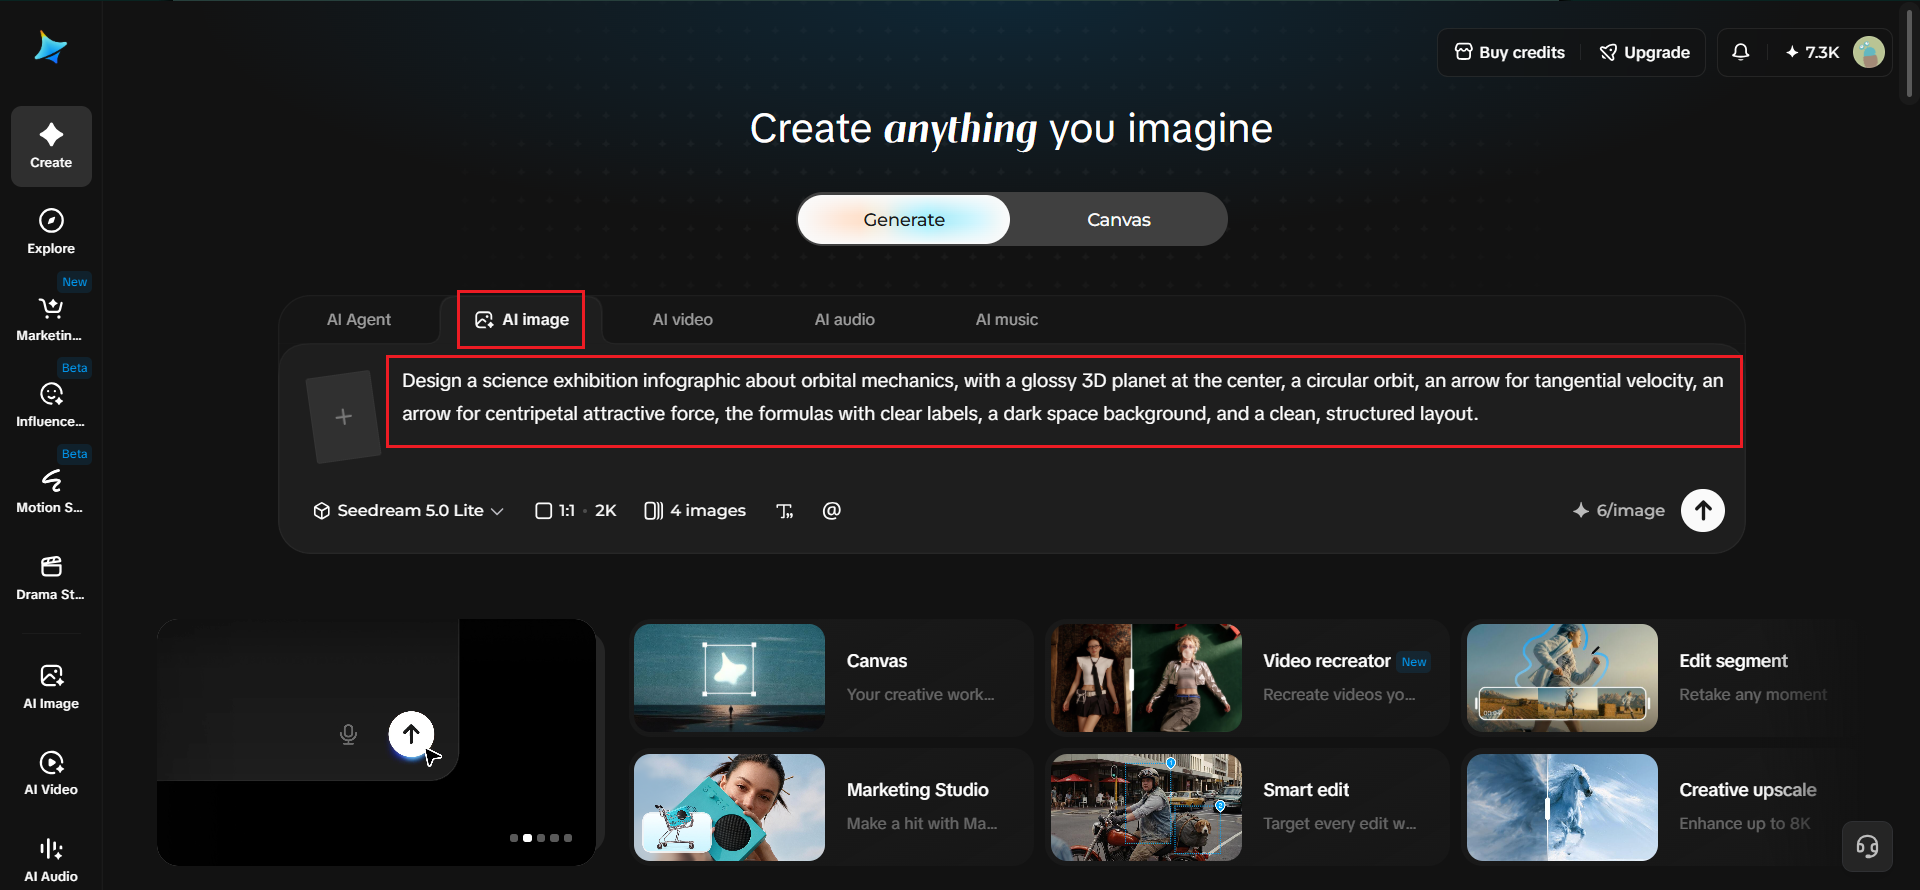
Open Dreamina, click "AI Image", and describe the image you want to produce.
Example prompt: Design a science exhibition infographic about orbital mechanics, with a glossy 3D planet at the center, a circular orbit, an arrow for tangential velocity, an arrow for centripetal attractive force, the formulas with clear labels, a dark space background, and a clean, structured layout.
Step 2: Choose a model, settings, and generate
Choose "Image 5.5 by Seedream 5.5" and adjust the image settings to match your needs, such as aspect ratio, resolution, and number of outputs. Once done, click "Generate" to build the infographic.
Step 3: Refine and export
Fine-tune your specific areas by adjusting colors, shapes, text, or other visual details through follow-up edits. Once the infographic looks right, check the final layout and text for accuracy, then click "Download" to save the generated infographic image.
Check the formulas first
The manual lists two formulas for the orbital example: F = GMm/r² and v = √(GM/r). Before you generate, make sure the equations in your prompt are correct and written clearly.
Put each formula in quotation marks, as the prompt guide advises for text. After generation, read the rendered formulas symbol by symbol. Small text errors, such as a missing square or a swapped letter, can change the meaning, so a careful read is essential.
Check arrow directions and the radius
Arrows carry meaning. In the orbital example, the manual recommends checking the arrow directions and the starting point of the radius.
Ask yourself: does the velocity arrow point along the tangent? Does the force arrow point toward the planet's center? Does the radius begin at the right place? If any of these is wrong, correct it with a targeted edit that names the arrow and the direction you want.
Keep annotations clean and layered
Annotations should help, not crowd. Give each label a short phrase, and place it near the part it describes.
Describe visual hierarchy in your prompt: a large title, a main diagram, and smaller notes. Seedream 5.5 can vary text size to highlight key points, so ask for bigger text for the main idea and smaller text for supporting notes. White space around the diagram also improves readability.
Color schemes and canvas layout
Color helps readers separate ideas. A dark background with bright arrows and labels can feel scientific and modern, while a lighter scheme can feel friendly and educational.
Name your palette and your layout in the prompt, such as a symmetrical layout with a central diagram and notes on both sides. The manual lists canvas layout and color scheme optimization as part of complex content generation, so use the model to explore options.
Other infographic styles to explore
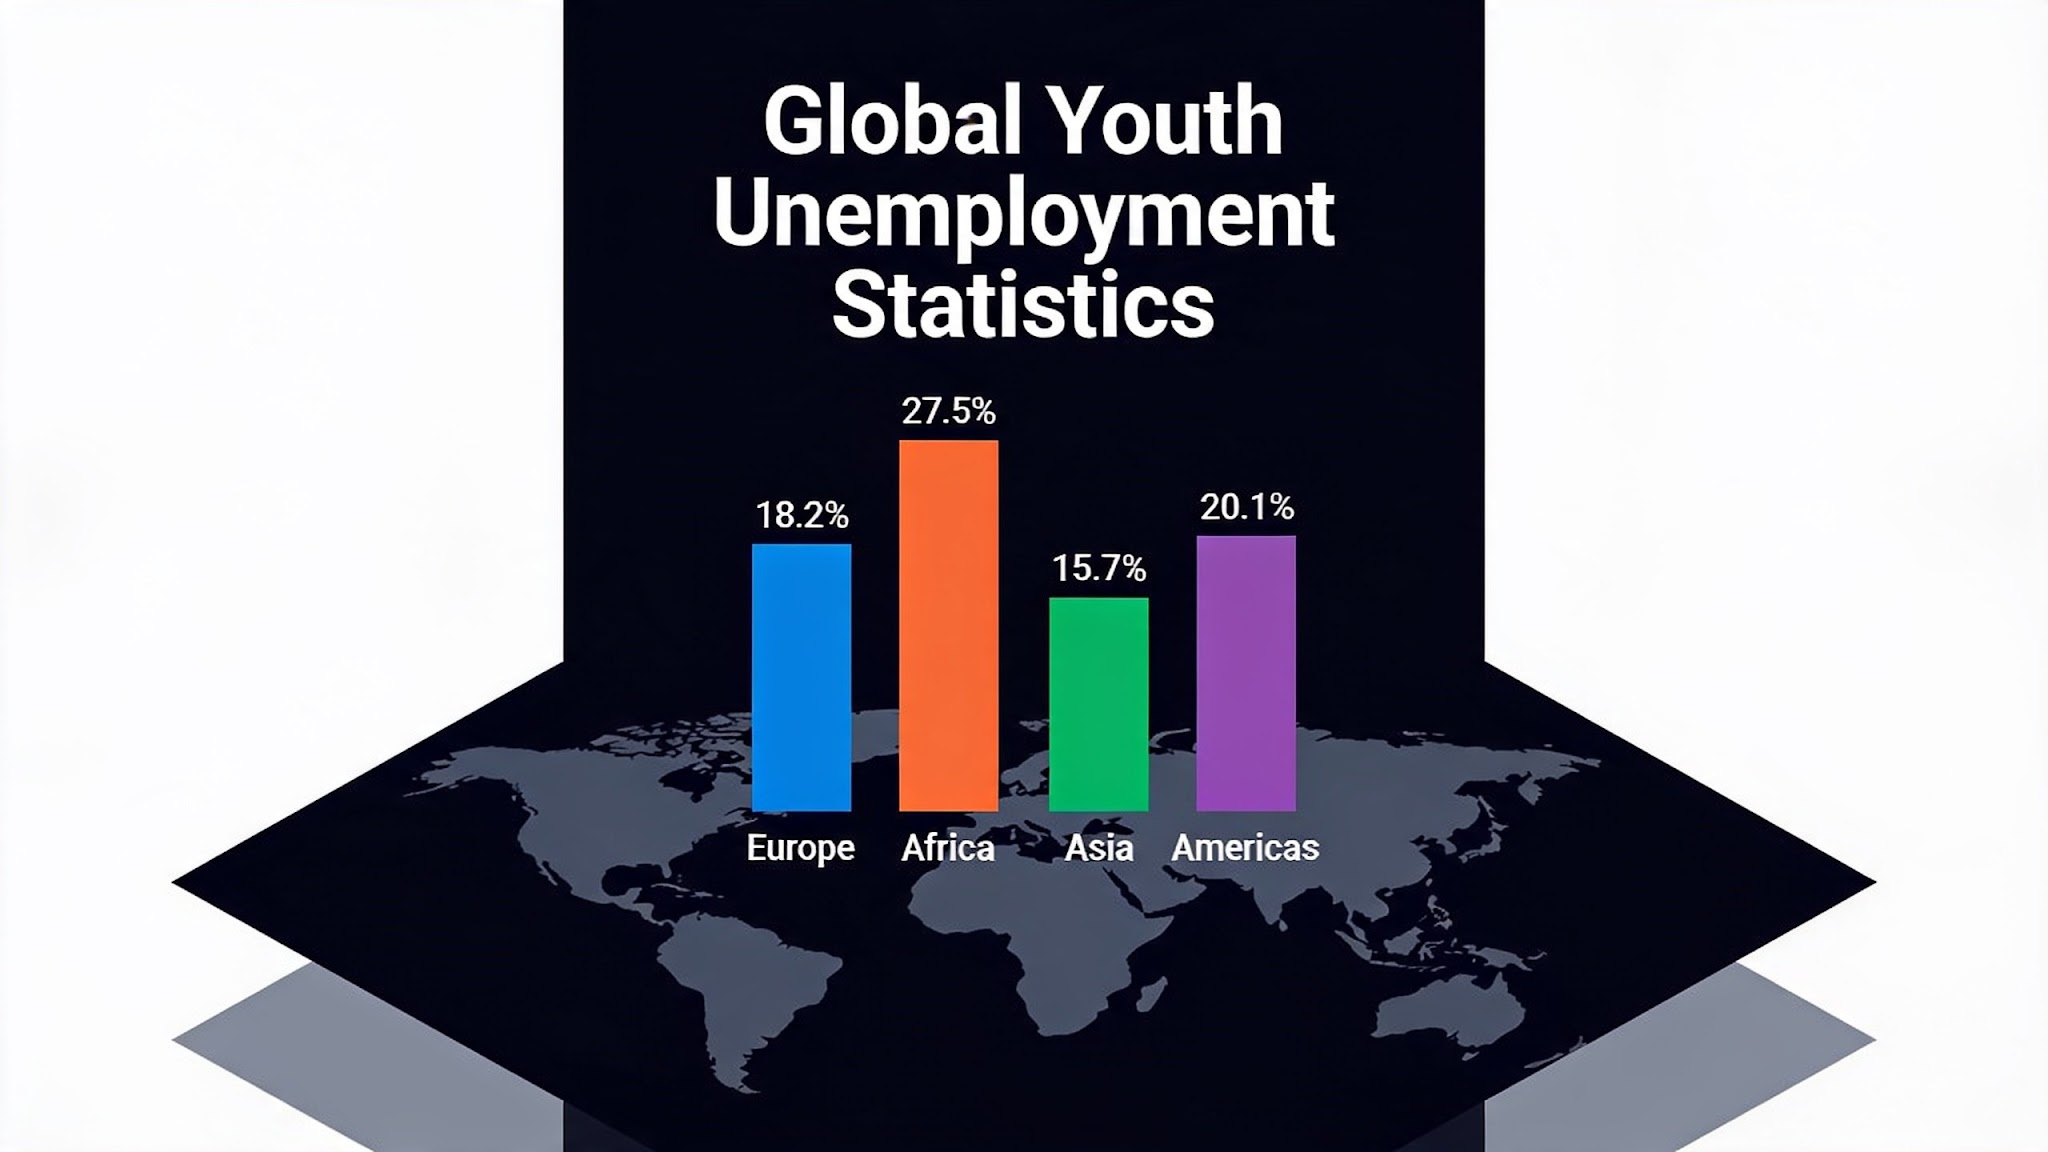
The manual shows several infographic directions beyond physics. They include a data poster in a histogram style, an architectural infographic with white line drawings on a dark industrial background, a chest training tutorial diagram, and a Chinese technology-style poster.
Each uses a clear structure with a central visual and orderly information modules. Study the pattern and adapt it to your own subject, whether that's science, sports, design, or business.
Be honest about accuracy limits
The manual is careful about limits. It notes that the orbital figure is not drawn to scale, and that formal scientific diagrams still need accurate drawing and acceptance.
Treat Dreamina's output as a polished concept or teaching visual, not a certified engineering drawing. If precision matters, have an expert review the final image and redraw anything that needs exact proportions.
Verify the facts before you design
The manual also explains that the knowledge in its demos was looked up and checked first, and that this does not prove the model's own online search was verified.
Follow the same habit. Confirm your formulas, values, and labels from a trusted source before putting them in a prompt. Starting from checked information protects your infographic from avoidable errors.
Final thoughts
Technical infographics become far more approachable with Dreamina's Seedream 5.5. You can describe a structure, place formulas and arrows, add clean annotations, and explore color and layout options in a few clicks. The orbital mechanics example shows how a 3D planet, a circular orbit, and clear labels can come together in one organized image.
With that mindset, Dreamina becomes a fast way to draft teaching visuals, exhibition graphics, and explainers that look professional and communicate clearly.
Related Posts

Best Application Security Platforms for Modern Development Teams
A roundup of leading application-security platforms, led by Aikido Security, which unites code scanning, cloud posture management and developer-led remediation in one place.
How Artificial Intelligence Is Changing the Way We Consume News and Entertainment
AI now shapes the news we see and the shows and music we discover, from chatbots and search summaries to dubbing and AI-generated tracks. Here is what to watch for.

Top 10 Ways to Receive SMS Online: Virtual Numbers, Apps and Services Compared
A rundown of ten modern ways to receive SMS without a physical SIM, from virtual numbers to eSIM multi-line profiles and satellite-to-cell gateways.
Pocket AI vs Plaud Note Pro (2026): Which AI Recorder Wins?
A detailed comparison of Pocket AI and Plaud Note Pro covering price, transcription limits, meeting pickup and data privacy to help you pick the right AI recorder.
0 Comments
Join the discussion and share your thoughts
No Comments Yet
Be the first to share your thoughts on this article!