Grafana Review 2026: Dashboard, Pricing, Login, Download, Free Plan & FAQs

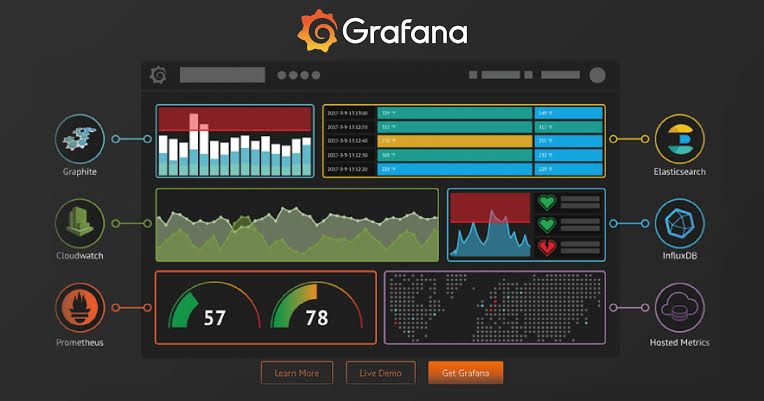
Table of Contents
Grafana has been the name that comes up first whenever engineers talk about dashboards. It has grown from a side project into one of the most widely used observability platforms in the world, and in 2026 it still sits at the center of how teams watch over their servers, applications and infrastructure. We spent weeks going through the platform ourselves, comparing pricing pages, testing the free tier, reading through community forums and checking what current users are saying, so this review reflects what Grafana actually looks like today, not what it looked like a few product cycles ago.
This piece covers everything a reader searching for Grafana in 2026 tends to want to know: how the dashboards work, what the pricing structure really costs, how login and download work for both the cloud and self hosted versions, whether the free plan is actually usable, and how the overall experience holds up. We close with a full profile table and answers to the questions people keep typing into search bars.

Grafana Profile at a Glance
Full name
Grafana (Grafana Labs)
Founded
2014, first released as an open source project by Torkel Odegaard
Company founded
2015, originally named Raintank, renamed Grafana Labs in 2017
Founders
Raj Dutt, Torkel Odegaard, Anthony Woods
CEO
Raj Dutt
Headquarters
New York City, with a fully remote team across 50+ countries
Category
Observability and monitoring, dashboards, data visualization
Website
grafana.com
Core products
Grafana OSS, Grafana Cloud, Grafana Enterprise, Loki, Tempo, Mimir, Pyroscope, k6
License (OSS)
AGPLv3 and Apache 2.0, self hosted and free
Free plan
Yes, Grafana Cloud Free tier and fully free self hosted OSS edition
Starting paid price
From around $19 per month base plus usage on Grafana Cloud Pro
Enterprise pricing
Custom quotes, typical minimum commitment around $25,000 per year
Platforms
Linux, Windows, macOS, Docker, ARM64
Our rating
3.7 out of 5
Full name | Grafana (Grafana Labs) |
Founded | 2014, first released as an open source project by Torkel Odegaard |
Company founded | 2015, originally named Raintank, renamed Grafana Labs in 2017 |
Founders | Raj Dutt, Torkel Odegaard, Anthony Woods |
CEO | Raj Dutt |
Headquarters | New York City, with a fully remote team across 50+ countries |
Category | Observability and monitoring, dashboards, data visualization |
Website | grafana.com |
Core products | Grafana OSS, Grafana Cloud, Grafana Enterprise, Loki, Tempo, Mimir, Pyroscope, k6 |
License (OSS) | AGPLv3 and Apache 2.0, self hosted and free |
Free plan | Yes, Grafana Cloud Free tier and fully free self hosted OSS edition |
Starting paid price | From around $19 per month base plus usage on Grafana Cloud Pro |
Enterprise pricing | Custom quotes, typical minimum commitment around $25,000 per year |
Platforms | Linux, Windows, macOS, Docker, ARM64 |
Our rating | 3.7 out of 5 |
What Is Grafana, Exactly?
Grafana is an open source platform for querying, visualizing and alerting on data, no matter where that data lives. It started in 2014 when Torkel Odegaard forked a project called Kibana because he wanted better graphing options for time series data. That small fork eventually became a company, Grafana Labs, founded a year later with Raj Dutt and Anthony Woods. Today Grafana Labs runs Grafana OSS, the free self hosted version, alongside Grafana Cloud, a fully managed version, and Grafana Enterprise for large organizations with stricter support and compliance needs.
The platform connects to more than one hundred data sources, including Prometheus, Loki, Elasticsearch, InfluxDB, MySQL, PostgreSQL and cloud provider metrics from AWS, Azure and Google Cloud. Rather than locking teams into one storage backend, Grafana positions itself as the visualization layer that sits on top of whatever a team already uses, which is a big part of why it has stayed popular for over a decade.
Grafana Dashboard: What Makes It Stand Out
Dashboards are the heart of Grafana, and this is genuinely where the product still shines. A dashboard in Grafana is a collection of panels, and each panel can pull from a different data source, run its own query, and render as a graph, table, heatmap, gauge, or a dozen other visualization types. You can mix a Prometheus metric panel next to a log panel from Loki on the same screen, which is something few competitors handle as cleanly.
- Template variables let one dashboard serve many environments or teams by swapping values like server name or region without rebuilding anything.
- The panel editor supports transformations, so raw query results can be reshaped, joined or filtered before they ever hit the chart.
- Grafana's public dashboard library has thousands of ready made dashboards contributed by the community, which saves a lot of setup time for common tools like Kubernetes, Nginx or PostgreSQL.
- Alerting is built directly into the dashboard layer now, so a panel can trigger a notification the moment a threshold is crossed, without needing a separate tool.
The one thing to know going in is that Grafana dashboards have a learning curve. Simple graphs are quick to build, but anything involving multiple transformations or nested variables takes time to get comfortable with. Once that curve is behind you, the flexibility is hard to match.
Grafana Pricing in 2026
Grafana's pricing has always been layered, and 2026 is no different. There are three broad paths: self hosting Grafana OSS for free, using Grafana Cloud with usage based billing, or moving up to Grafana Enterprise with negotiated contracts.
- Grafana OSS, self hosted: completely free under an open source license, forever, with no user limits. You provide the infrastructure and maintenance.
- Grafana Cloud Free: no cost, no credit card required. Includes 10,000 active metric series, 50 GB each of logs, traces and profiles, and three active users, all with 14 day retention.
- Grafana Cloud Pro: starts around $19 per month as a base platform fee, then usage is billed on top, roughly $6 to $8 per 1,000 active metric series, around $0.40 to $0.50 per GB for logs and traces, and about $8 per active visualization user per month.
- Grafana Cloud Advanced: a step up from Pro with extended retention, higher SLAs and more support, generally priced in the $50 to $60 per month range plus usage.
- Grafana Enterprise: custom pricing for large organizations, typically requiring a minimum annual commitment reported around $25,000, covering enterprise plugins, dedicated support, advanced authentication and reporting.
The part that trips people up is that Grafana Cloud pricing is not a flat subscription. It is a metered bill built from several independent usage lines, metrics, logs, traces, profiles, active users and now an AI assistant seat, and each one ticks on its own schedule. Small teams rarely feel this, but organizations with high cardinality metrics or heavy log volume can see costs climb quickly if nobody is watching the dials. Our advice is simple: use the built in usage limits and alerts from day one, because they are the easiest way to avoid a surprise invoice.
Buyers negotiating Enterprise contracts tend to get meaningfully better terms with annual prepayment or predictable volume commitments, with reported discounts commonly falling in the 10 to 20 percent range off list pricing. If your organization is large enough to be talking to sales, it is worth asking.
Grafana Login and Download
Getting into Grafana depends on which version you are using. For Grafana Cloud, you sign in at grafana.com through the standard login page, which supports email and password as well as single sign on options for Google, GitHub, Microsoft and SAML based enterprise identity providers, depending on your plan.
For the self hosted OSS or Enterprise edition, the installer is available for Linux, Windows, macOS, Docker and ARM64 devices directly from the official download page on grafana.com. Once installed, the server runs locally and the first login uses the default admin account, admin as both username and password, which you are prompted to change immediately on first sign in. Docker users can get a working instance running in under a minute with a single run command pointing at the official Grafana image.
One small thing worth flagging: the default admin and password combination is well known, so leaving it unchanged on anything internet facing is a genuine security risk. Change it before you do anything else.
Is Grafana Free? What You Actually Get
Yes, and this is one of the more generous free tiers in the observability space. There are two separate free paths. The first is Grafana OSS, the open source core, which is free forever with no restrictions on users or dashboards, provided you are willing to host and maintain it yourself. The second is Grafana Cloud Free, a hosted version that needs no credit card and does not expire, bundling metrics, logs, traces, profiles, basic synthetic monitoring and a small allowance of k6 performance testing.
For a solo developer, a small startup, or a hobby project monitoring a home server, the free tier is usually enough on its own. Teams tend to outgrow it once they pass a few thousand active metric series or need more than three active dashboard users, which is when the Pro usage charges start to apply.
User Experience: What It's Actually Like to Use
Grafana's interface has matured a lot since its early years. The navigation is cleaner, dashboard search is faster, and the newer Explore view makes it much easier to poke around raw logs and metrics before committing to a formal panel. The addition of Grafana Assistant, the platform's AI feature that launched at the start of 2026, adds a conversational way to build queries and troubleshoot dashboards, which newer users seem to appreciate more than long time users who already know the query languages by heart.
What users like most, based on community discussions and review sites, is the depth of customization and the fact that Grafana refuses to lock you into one data backend. What users complain about most is the initial setup curve, particularly around writing PromQL or LogQL queries from scratch, and the way costs on Grafana Cloud can become harder to predict as usage scales. Performance on large dashboards with many panels can also lag if queries are not optimized, though this is more a function of the underlying data source than Grafana itself.
Mobile use is limited. Grafana is built as a desktop first tool, and while dashboards are viewable on a phone browser, there is no dedicated mobile app, so anyone expecting native mobile alerting management will be a little disappointed.
Nubia Magazine verdict
We rate Grafana 3.7 out of 5 for 2026. It earns strong marks for flexibility, its dashboard ecosystem and a free tier that genuinely holds up for small teams. It loses points for a pricing structure that takes real effort to forecast at scale, a learning curve that is steeper than some newer, more opinionated competitors, and a mobile experience that has not kept pace with the rest of the product. For teams who need deep, source agnostic visualization and are comfortable investing time upfront, Grafana remains one of the strongest choices on the market. For teams that want something simpler out of the box, the setup time may feel like a tax.
Frequently Asked Questions
1. Is Grafana free to use in 2026?
Yes. Grafana OSS is free and open source with no user limits if you self host it, and Grafana Cloud offers a free tier with generous allowances for metrics, logs, traces and a handful of active users, with no credit card required.
2. How much does Grafana Cloud cost per month?
Grafana Cloud Pro starts at roughly $19 per month as a base fee, plus usage charges for metrics, logs, traces and active users. Most small teams end up paying somewhere between $20 and $150 a month depending on data volume, while larger teams on Enterprise plans negotiate custom annual contracts.
3. Where do I download Grafana?
The official download is at grafana.com/grafana/download, with installers for Linux, Windows, macOS, Docker and ARM64. Avoid third party mirrors when possible and verify checksums on production installs.
4. What is the default Grafana login?
For a fresh self hosted install, the default username and password are both admin. You will be prompted to set a new password on first login, and you should do this immediately, especially on any server exposed to the internet.
5. Is Grafana the same as Grafana Cloud?
No. Grafana, or Grafana OSS, is the open source software you can install anywhere for free. Grafana Cloud is Grafana Labs' managed hosting of that same software plus additional services like Loki, Tempo and Mimir, billed on a usage basis.
6. Can I use Grafana without Prometheus?
Yes. Prometheus is the most common pairing, but Grafana connects to more than one hundred data sources including Elasticsearch, InfluxDB, MySQL, PostgreSQL, CloudWatch, Azure Monitor and many others.
7. Does Grafana have a mobile app?
Not a dedicated one. Grafana is designed as a desktop first web application. Dashboards can be viewed in a mobile browser, but there is no native iOS or Android app for managing alerts or editing dashboards.
8. Is Grafana good for beginners?
It is approachable for simple use cases, especially with the community dashboard library and the newer Grafana Assistant AI helper, but building custom queries from scratch does involve a real learning curve, particularly around PromQL and LogQL.
9. Who owns Grafana?
Grafana is developed by Grafana Labs, a company founded in 2014 by Torkel Odegaard, Raj Dutt and Anthony Woods. Raj Dutt currently serves as CEO. The company is privately held and headquartered in New York City.
10. How does Grafana compare to Datadog?
Grafana tends to be cheaper at scale and avoids vendor lock in since it works with open source backends you can self host. Datadog charges per host and per product, which is often simpler to predict but usually more expensive as data volume grows. Datadog also ships more out of the box, while Grafana expects more setup and configuration.
Related Posts


1 Comment
Join the discussion and share your thoughts